I was recently contacted by a confused user who uses both ESRI's ArcGIS and Autodesk's Map 3D products. He was provided an installation of ArcGIS 9.3 + MSD for AutoCAD. He was wondering what MSD was and how it compares to AutoCAD Map 3D.
First of all MSD is designed to supplement the lack of GIS functionality for VANILLA AutoCAD. If you have AutoCAD Map 3D or Civil 3D, you already have a Superset of the functionality provided by MSD. Here are some of the technical specifications comparing MSD on AutoCAD to AutoCAD Map. Although the lists are not comprehensive, they represent the core functionality of both products:
MSD on AutoCAD:
- Only a few coordinate systems supported
- Query only, No editing
- Can’t push design data into GIS
- Uses Object Data, no direct connect to GIS server
- No support for geo-referenced Raster Imagery
- Can’t access web based data sources such as WMS, WFS
MSD is basically an automated import utility with coordinate systems and some stylization capability. The key is that ESRI is targeting VANILLA AUTOCAD.
AutoCAD Map 3D 2009:
- NATIVE (not an import) live connection (FDO) to ALL ESRI formats, Mapinfo, Microstation, Oracle, Microsoft SQL Server, MySQL, ODBC, others, and all other databases provided by OSGEO.com open source community of which there are hundreds
- Over 5000 global coordinate systems
- Geo-referencing and management of Imagery
- Direct connect, query, stylize, theme and EDIT data in native sources (all named above)
- WMS, WFS data sources
- Map book creation
- Network and Polygon Topology analysis
- Direct connect to various surface formats such as DEM, stylization, contouring, draping
- Database Joins
- Push design data en mass into a database with Bulk-Copy
Summary:
MSD is a good product provided free if you already own ESRI products. It is not intended for use with AutoCAD Map. Doing so would downgrade the functionality built into AutoCAD Map. AutoCAD Map is a full-featured design, data management and GIS application.
Wednesday, February 25, 2009

Monday, December 15, 2008
Using a Drawing Based Image Source
Working with raster images can be challenging. This blog will introduce you to a technique for managing and using geo-referenced image tiles that utilizes a drawing as a container.
So, why do this? Why not just use FDO? PERFORMANCE, PERFORMANCE, PERFORMANCE! Ok, so then what are the advantages over accessing raster images directly using Mapinsert? First of all, geo-referenced imagery is often established in a coordinate system and units that don’t match your project. So you’re left with figuring out how to re-project image files into your coordinate system.
If you have images with world files, you need to generate new ones for your coordinate system and units. You may have images with geo-referencing information embedded into the image files such as a Geo-TIFF . To use such images you must have programming skills or an application to update the information in the header.
Once you create a drawing based image source, you can attach and query it. Doing this provides more control over imagery compared to using Mapinsert. Some of the advantages include:
While the same methodology can be used with FDO, and it is simpler to set up, you will see an extreme performance degradation of pan/zoom with FDO. Once you have an image source drawing set up, you can re-use it in many projects. If you set up a template drawing with the imagery already attached, stylized and organized, you can use this as a starting point to create new projects, and never worry about that set of images again!
Since AutoCAD Map has the ability to attach and query drawings, you can treat a drawing with images like a database. When you attach and query data sources with coordinate systems other than the current one, data is automatically re-projected.
Here’s the conceptual framework:
• Create a source drawing with a coordinate system
• Insert geo-referenced images
• Save drawing (A)
• Open project drawing with a coordinate system, Attach (A)
• Query images from Display Manager
• Use Display Manager to manage imagery
Step-by-Step Process: This example used USGS 100k Quads as Geo-TIFFs. Several images are inserted using Mapinsert. The images are clipped to hide the title-block & border information from each image. This drawing is saved, then attached to a project drawing. (could be alternately used as part of a template) Queries are done to create Display Manager elements. These elements are then organized and stylized.
Creating the Image Source Drawing:
Open a new drawing and set the coordinate system to match that of the images. The images in this example are referenced in NAD27, UTM Zone 13, Meter. You also need to set the correct units:
Setting Coordinate System & Units:

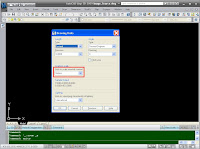
Inserting Images & Result:


Clipping Images
The USGS quad borders need to be clipped to show only the map content. The next four steps show you how to clip boundaries. A reference grid has been overlaid to make clipping easier:

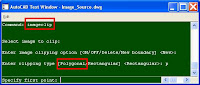
Clipping Images - Polygonal & First Image Clip Result:
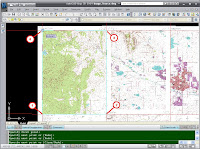
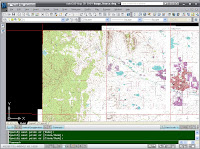
Clipping Images Completed:
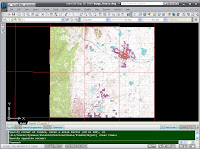
Save and close the drawing.
Attaching & Using the Image Source Drawing
Open the drawing that will use the new image source. The image below shows a project drawing with a coordinate system set:
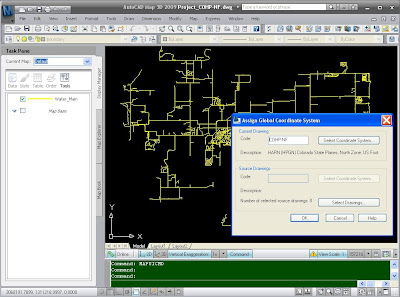
Attaching Image Source Drawing & Attached Image Source:


Previewing Image Frames
At this point you need a guide for querying each image. There are several options for doing this. Only two will be described here. The first is to simply preview the image frames. The down side to this method is that after you query each image you have to re-preview the image frames. The second option is to query the grid used to clip the images in draw mode. If you choose this option, It is recommended you use the Display Manager, not Map Explorer to do this. Only the first option will detailed in the two images below.

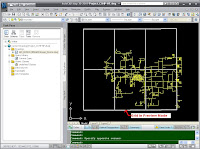
In order to organize images in the Display Manager, I recommend creating an image group. This will facilitate turning all images on or off as a group, as well as hiding or displaying the list. Creating an Image Group in Display Manager:

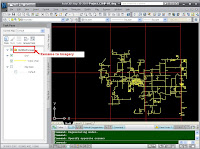
Querying Images - Starting the Query Definition:

Defining the Query
The next six steps show you how to define a boolean query for each image.
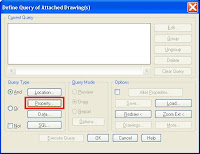
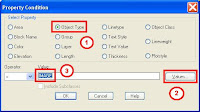
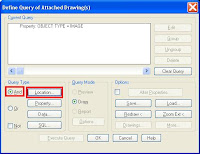
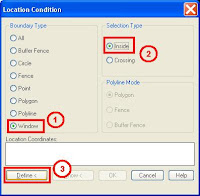
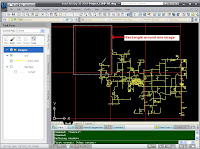
After you specify the query window, your query definition should look like the image below:
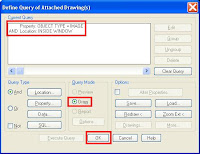
Image Query Result:
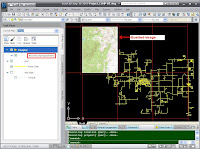
Each query creates a "layer element" with the default name of 'Attached Drawing Element'. You can rename these one at a time after each query or do them all at once when you have finished querying all the images.
Rename Image Elements
Now, rename the image elements so you can identify them in order to manipulate them. To determine the name for each image, select it, then view it's properties. The image below shows all queried image elements renamed:

Change Display Order
At this point you will notice that the images are covering up the design content. This can be fixed by changing the Draw Order:

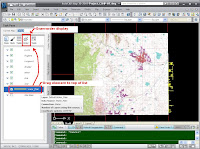
Result of Draw Order change showing Group display:

Adding Fade to the Images
You will notice that the yellow water lines are hard to see against the white background of the quad sheets. You could of course change their color, but I want to show you an alternative. Let's apply a fade to the images which will result in darkening them. To do this, follow the steps below.
Adding a raster style:

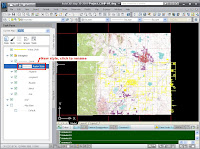
Setting Fade:

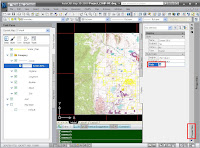
First image faded:
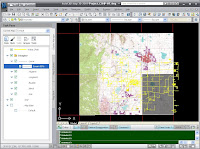
Copying & Pasting a style (next 3 images)...

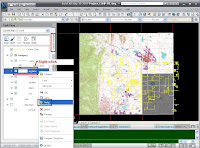
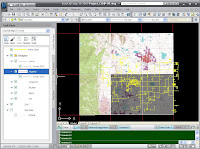
The resulting images faded and organized:
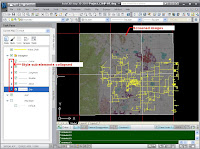
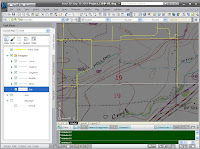
Close-up showing faded image with yellow vectors overlaid:
Conclusion
Now you have a drawing based image source with access and controls centralized in the Display Manager, the same location where FDO layers appear. This makes it much easier to manage projects that contain imagery within AutoCAD Map. You can use the Display Manager to easily perform tasks such as control visibility, organize & stylize imagery. Stay tuned for future blogs that will cover using imagery from file based FDO data sources as well as Web Map Source (WMS). Later, advanced topics such as creating an image tile set using AutoCAD Raster Design, and dynamic display of images in current window using VBA will be addressed. Until then, Happy Mapping!!!
So, why do this? Why not just use FDO? PERFORMANCE, PERFORMANCE, PERFORMANCE! Ok, so then what are the advantages over accessing raster images directly using Mapinsert? First of all, geo-referenced imagery is often established in a coordinate system and units that don’t match your project. So you’re left with figuring out how to re-project image files into your coordinate system.
If you have images with world files, you need to generate new ones for your coordinate system and units. You may have images with geo-referencing information embedded into the image files such as a Geo-TIFF . To use such images you must have programming skills or an application to update the information in the header.
Once you create a drawing based image source, you can attach and query it. Doing this provides more control over imagery compared to using Mapinsert. Some of the advantages include:
- Advanced visibility controls
- Stylization
- Image organization and management using the Display Manager
While the same methodology can be used with FDO, and it is simpler to set up, you will see an extreme performance degradation of pan/zoom with FDO. Once you have an image source drawing set up, you can re-use it in many projects. If you set up a template drawing with the imagery already attached, stylized and organized, you can use this as a starting point to create new projects, and never worry about that set of images again!
Since AutoCAD Map has the ability to attach and query drawings, you can treat a drawing with images like a database. When you attach and query data sources with coordinate systems other than the current one, data is automatically re-projected.
Here’s the conceptual framework:
• Create a source drawing with a coordinate system
• Insert geo-referenced images
• Save drawing (A)
• Open project drawing with a coordinate system, Attach (A)
• Query images from Display Manager
• Use Display Manager to manage imagery
Step-by-Step Process: This example used USGS 100k Quads as Geo-TIFFs. Several images are inserted using Mapinsert. The images are clipped to hide the title-block & border information from each image. This drawing is saved, then attached to a project drawing. (could be alternately used as part of a template) Queries are done to create Display Manager elements. These elements are then organized and stylized.
Creating the Image Source Drawing:
Open a new drawing and set the coordinate system to match that of the images. The images in this example are referenced in NAD27, UTM Zone 13, Meter. You also need to set the correct units:
Setting Coordinate System & Units:


Inserting Images & Result:


Clipping Images
The USGS quad borders need to be clipped to show only the map content. The next four steps show you how to clip boundaries. A reference grid has been overlaid to make clipping easier:


Clipping Images - Polygonal & First Image Clip Result:


Clipping Images Completed:

Save and close the drawing.
Attaching & Using the Image Source Drawing
Open the drawing that will use the new image source. The image below shows a project drawing with a coordinate system set:

Attaching Image Source Drawing & Attached Image Source:


Previewing Image Frames
At this point you need a guide for querying each image. There are several options for doing this. Only two will be described here. The first is to simply preview the image frames. The down side to this method is that after you query each image you have to re-preview the image frames. The second option is to query the grid used to clip the images in draw mode. If you choose this option, It is recommended you use the Display Manager, not Map Explorer to do this. Only the first option will detailed in the two images below.


In order to organize images in the Display Manager, I recommend creating an image group. This will facilitate turning all images on or off as a group, as well as hiding or displaying the list. Creating an Image Group in Display Manager:


Querying Images - Starting the Query Definition:

Defining the Query
The next six steps show you how to define a boolean query for each image.


After you specify the query window, your query definition should look like the image below:

Image Query Result:

Each query creates a "layer element" with the default name of 'Attached Drawing Element'. You can rename these one at a time after each query or do them all at once when you have finished querying all the images.
Rename Image Elements
Now, rename the image elements so you can identify them in order to manipulate them. To determine the name for each image, select it, then view it's properties. The image below shows all queried image elements renamed:

Change Display Order
At this point you will notice that the images are covering up the design content. This can be fixed by changing the Draw Order:


Result of Draw Order change showing Group display:

Adding Fade to the Images
You will notice that the yellow water lines are hard to see against the white background of the quad sheets. You could of course change their color, but I want to show you an alternative. Let's apply a fade to the images which will result in darkening them. To do this, follow the steps below.
Adding a raster style:


Setting Fade:


First image faded:

Copying & Pasting a style (next 3 images)...


The resulting images faded and organized:

Close-up showing faded image with yellow vectors overlaid:

Now that you have images attached & organized, it's easy to change settings like fade or control visibility as can be seen in the next two images:

Conclusion
Now you have a drawing based image source with access and controls centralized in the Display Manager, the same location where FDO layers appear. This makes it much easier to manage projects that contain imagery within AutoCAD Map. You can use the Display Manager to easily perform tasks such as control visibility, organize & stylize imagery. Stay tuned for future blogs that will cover using imagery from file based FDO data sources as well as Web Map Source (WMS). Later, advanced topics such as creating an image tile set using AutoCAD Raster Design, and dynamic display of images in current window using VBA will be addressed. Until then, Happy Mapping!!!
Subscribe to:
Posts (Atom)

